User Manual
Configuration tasks can be carried out either through the Energy Monitor user interface or via the command line. These tasks should only be performed by users with the necessary experience and permissions, particularly when using the command line.
Configuration Page
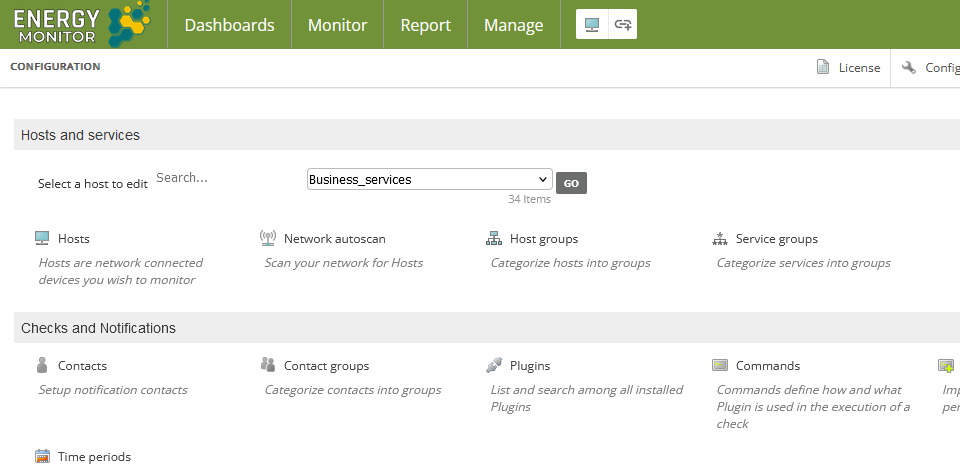
Most of Energy Monitor’s key configuration functions can be found on the configuration page, accessible by clicking Manage -> Configure.
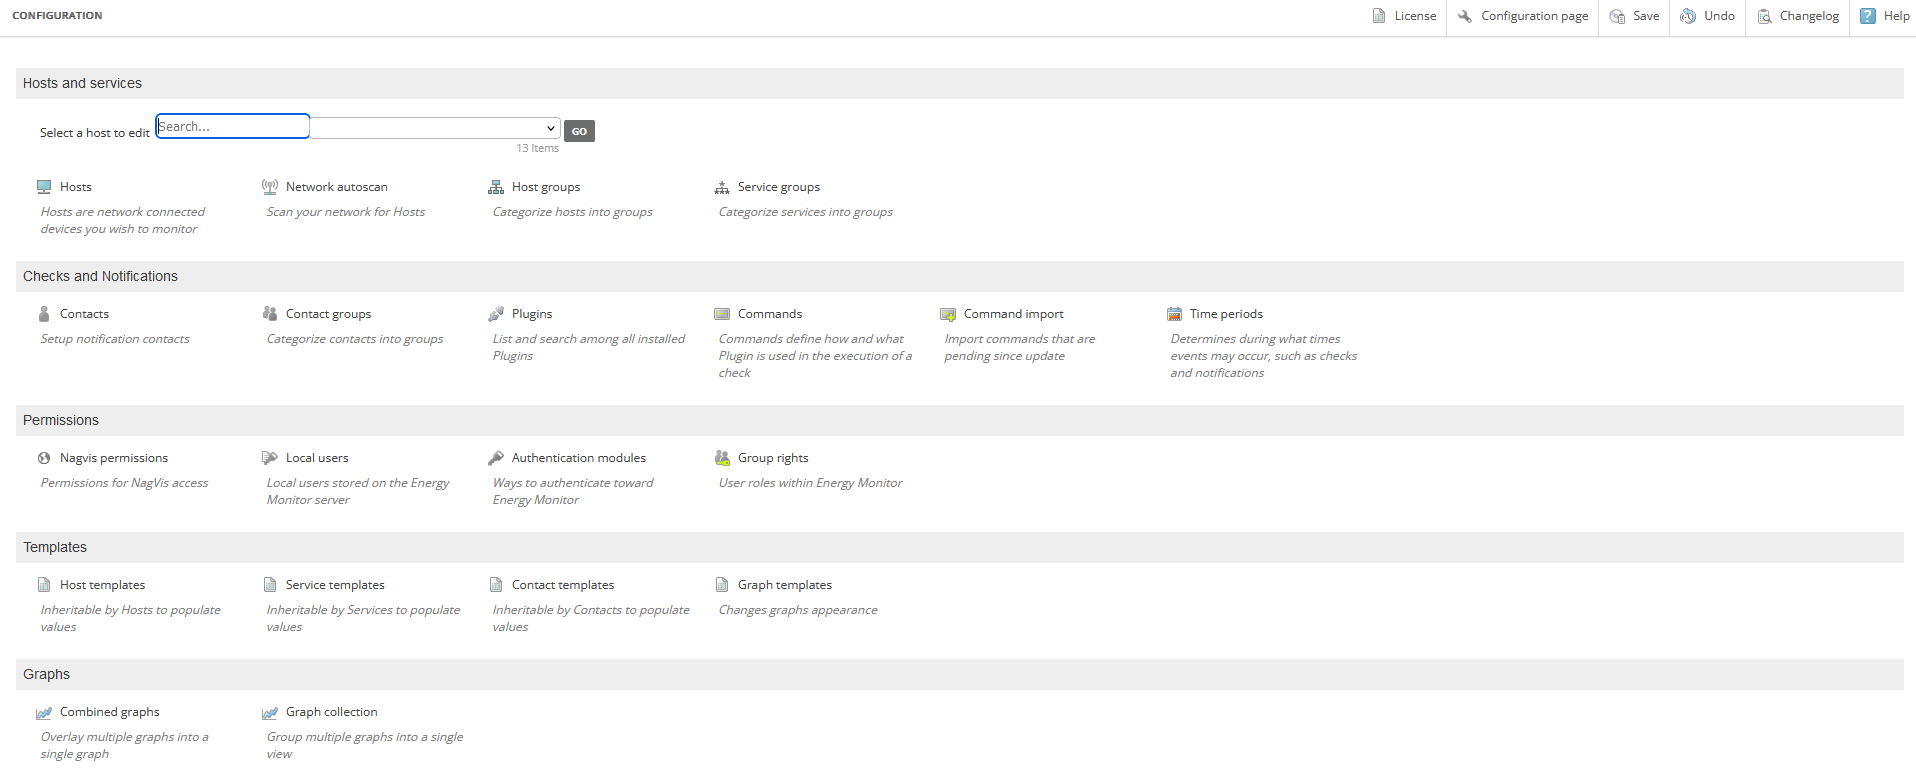
From the configuration page, you can manage the following:
Monitoring objects
Users, contacts, and permissions
Reusable objects: This includes templates, time periods, management packs, and commands. For more details, see Reusable configuration.
Graphs
Additional tasks you can perform:
Search for an existing host to configure.
View a list of plugins along with their support details.
Common Configuration Features
Different configuration functions share some common features:
Search field: Enter an existing configuration object to edit, or click New for a new configuration.
Related items links: Access related configuration items from the links on the right.
Object type menu: Switch between configuration pages for different object types using the menu on the right.
File ID field: Located at the bottom of the configuration values, this field specifies the system configuration file in the /etc directory where the configuration is stored, such as
/etc/hosts.cfg.
Note: It is not recommended to update the system configuration file directly.
Configuration Shortcuts
Energy Monitor provides several shortcuts to streamline the configuration process:
Clone objects
Copy objects
Propagate settings from one object to other objects of the same type
Propagate settings from services to buckets
Delete objects
Bulk delete objects
You can switch between object types using the Object type menu to view and configure related items. These shortcuts work consistently across all object types.
Saving Configuration Changes and Viewing the Changelog
To save your configuration changes, click Save in the top bar of the configuration page. Energy Monitor usually saves most configuration objects to the configuration database, with some exceptions such as the Permissions section. Visual cues indicate when you need to save a configuration, as explained in the workflow below:
Click an object on the configuration page and make changes.
Click Submit.
Repeat steps 1 and 2 as needed.
Click Save in the top bar of the configuration page to save all your changes and those made by other users.
When there are unsaved changes, the number of unsaved changes appears next to the Save button, and details are displayed next to the objects with unsaved changes.
Note: Users need export permissions to save changes.
Additional actions you can perform:
Undo: To revert all user changes since the last save, click Undo. This action provides the option to perform a complete reimport by clicking the displayed link.
Changelog: View the history of all configuration changes by clicking Changelog. Filter the list of changes by clicking Toggle filter bar and entering details of users, objects, and dates. Users with limited permissions will only see changes on hosts and services for which they are contacts.
Reusable Configuration
You can set up the following reusable configurations for use with other objects:
Time periods
Templates
Commands
Energy Monitor comes with default reusable configurations for each of these types. You can either use these default settings, modify them, or create your own custom configurations.
View active config
To view the details of the current configuration, select Manage > View active config from the menu. Use the Object type drop-down list to choose the specific object you wish to view.
You can view configurations for the following types:
Hosts
Services
Host groups
Service groups
Contacts
Contact groups
Time periods
Commands
To filter the displayed objects, enter a term in the filter field and click Filter. Additionally, you can click on links within the view to access details of related object configurations. For example, clicking a link in the Host Check Command column will take you to the related commands view.
Commands and custom variables
You can define command lines and create custom variables when setting up configuration objects, including templates, hosts, services, and contacts.
Configuration synchronization in distributed environment
In a distributed or load-balanced monitoring environment, Energy Monitor’s Merlin back end manages the synchronization of configuration updates on the master server.
Overseeing Hosts and Services
The following procedures outline how to add, update, and configure monitoring objects, including:
Hosts and host groups
Services and service groups
The sequence in which you create hosts, services, and their respective groups does not matter. For instance, you can add a host to an existing host group or create a new host group and then add a host to it. Additionally, a host can be added to multiple groups.
Note: Configuration changes are not finalized until you click Save, which saves your changes to the Energy Monitor database. For more details, refer to Saving configuration changes and viewing the changelog in the Introduction to configuration.
Caution: Using the user interface to configure Energy Monitor objects is the only supported method for updating object configurations in Energy Monitor. We do not support direct modifications to object configuration files. Energy Monitor uses Livestatus to parse configuration files, and manual changes to these files can cause conflicts with Livestatus data and API calls. However, advanced users can create custom configuration files.
For background information on hosts, services, host groups, and service groups, see Monitoring objects in Overview of Energy Monitor.
Procedure for Adding Windows Hosts to the Energy Monitor System
Adding Windows hosts to the Energy Monitor system requires several steps, which include installing the necessary software, configuring the monitoring agent, and verifying the connection. Below is a detailed procedure:
Step 1: Prepare the Windows Host
Ensure you have administrative access to the Windows host: You need administrative privileges to install software on the Windows host.
Install the required tools:
Download and install NSClient++ (a monitoring tool for Windows systems) from the NSClient++ website.
Step 2: Install and Configure NSClient++
Install NSClient++:
Run the downloaded installer and follow the installation instructions. Choose options such as installing it as a Windows service.
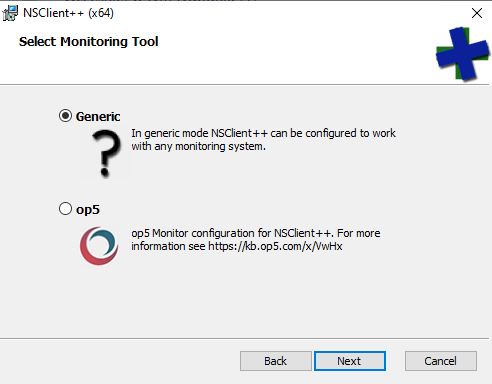
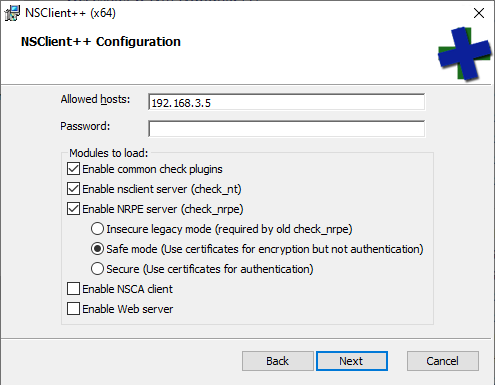
Provide atleast one ip of Energy Monitor instance.
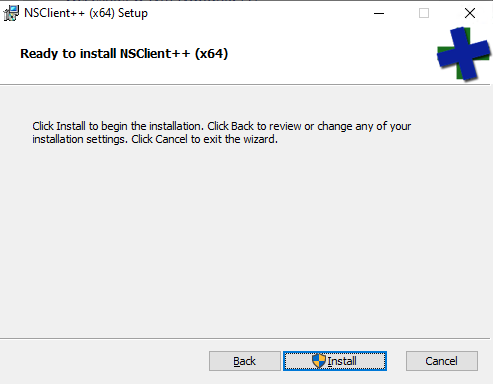
Confirm start of installation process.
Configure NSClient++:
Open the configuration file nsclient.ini, typically located in the NSClient++ installation directory (e.g., C:\Program Files\NSClient++).
Edit the configuration file to allow communication with the Energy Monitor server. Ensure that the appropriate modules are enabled, such as NRPE and CheckExternalScripts.
Example configuration:
[/settings/default]

; Undocumented key
allowed hosts = 192.168.3.5


; in flight - TODO
[/settings/NRPE/server]

; Undocumented key
ssl options =

; Undocumented key
verify mode = none

; Undocumented key
insecure = true

; Allow Arguements
allow arguments = true

; Allow nasty chars
allow nasty characters = true


; in flight - TODO
[/modules]

; Undocumented key
CheckExternalScripts = enabled

; Undocumented key
CheckHelpers = enabled

; Undocumented key
CheckEventLog = enabled

; Undocumented key
CheckNSCP = enabled

; Undocumented key
CheckDisk = enabled

; Undocumented key
CheckSystem = enabled

; Undocumented key
NSClientServer = enabled

; Undocumented key
NRPEServer = enabled
Restart the NSClient++ service:
After making changes to the configuration file, restart the NSClient++ service using the Windows Services Manager.
Step 3: Configure Energy Monitor
Log in to the Energy Monitor web interface:
Open a web browser and log in to the Energy Monitor admin panel.
Add a new host:
Navigate to Manage -> Configure -> Hosts.
Enter host details:
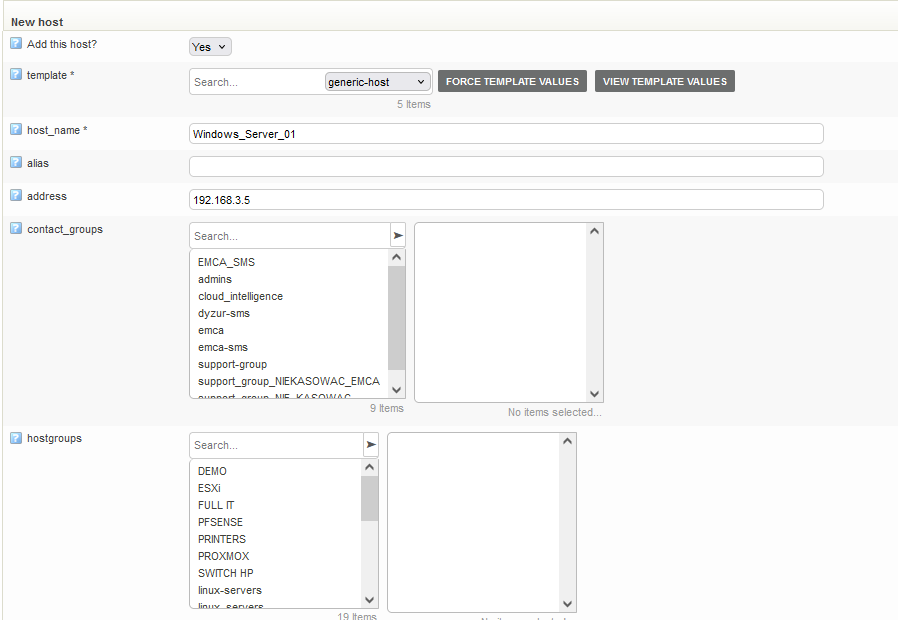
Provide the hostname, IP address, and other required details.
Save the configuration and perform a test:
Save the new host configuration and perform a monitoring test to ensure that Energy Monitor can communicate with the Windows host correctly.

Step 4: Add services
Add monitoring services such as availability checks, CPU usage, memory usage, disk usage, etc., using NSClient++ as the data source.
Ensure that you use the appropriate NRPE commands or other commands defined in the nsclient.ini file.
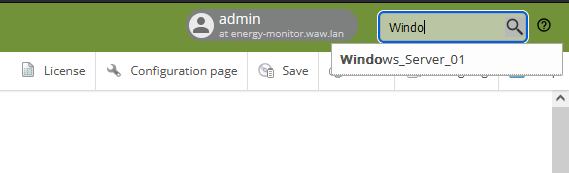
Search for added host:
Use a search bar
Open configuration:
Open configuration of freshly added host from listview:
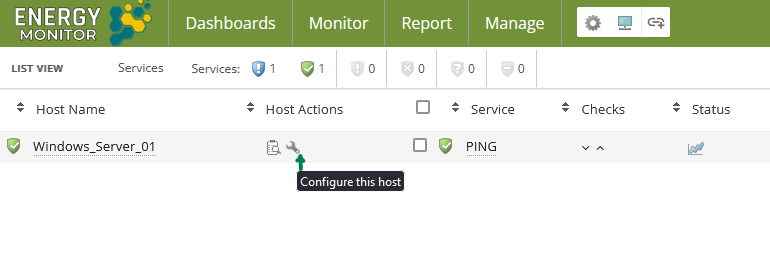
After open host configuration got to it services configuration:
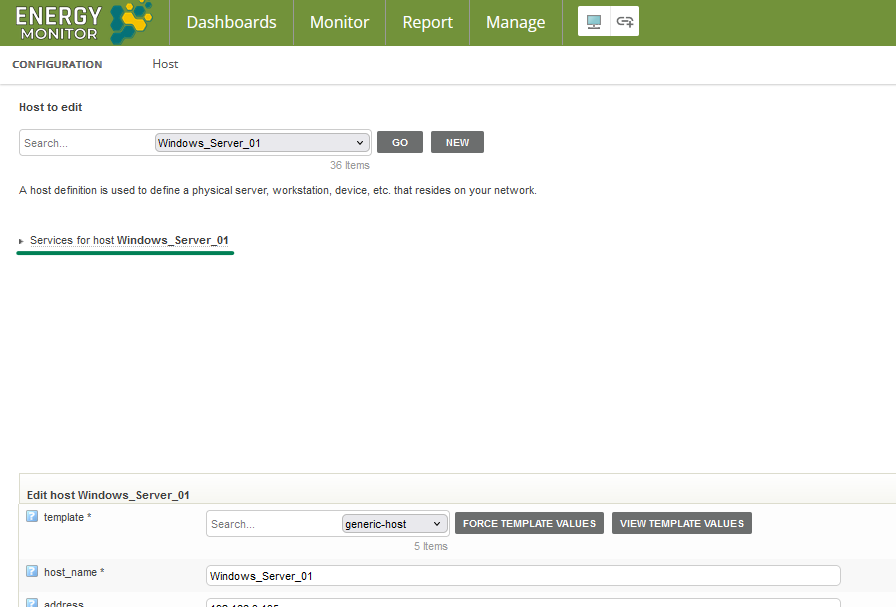
Add service:
Fill service description(reuired)
Choose correct
check_commandto monitor required parameterFill
check_command_argsif required or createCustom Variable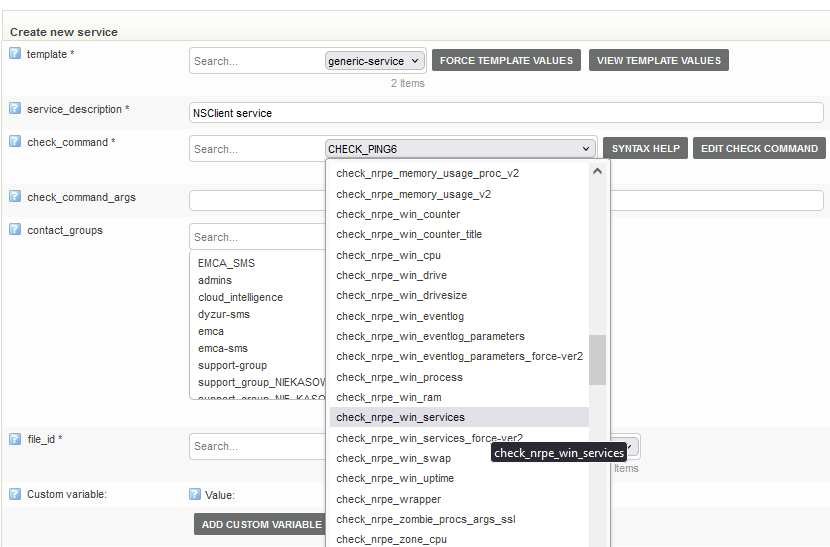
Test if configuration of new service is correct:
After filled up necessary firlds you can check response of service by clicking in
Test This Check: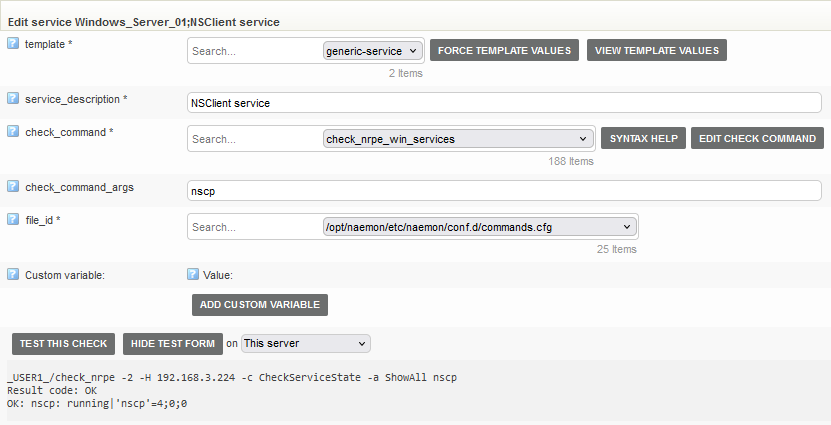
Submit and Save
All changes in configuration(like adding new object) need to be submited by clicking in submit button at the bottom of object configuration page.
Next you need to perform save like at “Add host” step.
Before perform save you can add as many services as you want.
Step 5: Verification and Monitoring
Check the status of the host and services:
Ensure that the newly added host and its services are visible in the Energy Monitor dashboard and that real-time data is being received.
Configure notifications:
Set up appropriate notifications to receive alerts in case of issues with the monitored Windows host.
Procedure for Monitoring Linux Systems with Energy Monitor
This documentation provides a step-by-step guide on how to monitor Linux systems using Energy Monitor. By following these instructions, you will be able to set up monitoring for various aspects of your Linux hosts, such as system performance, availability, and resource usage.
Prerequisites
Ensure that you have Energy Monitor installed and configured.
Ensure you have administrative access to both the Energy Monitor server and the Linux systems you want to monitor.
Step 1: Install NRPE and Nagios Plugins on Linux Host
Update Package Repository:
sudo apt update  # For Debian/Ubuntu
sudo yum update  # For CentOS/RHEL
Install NRPE and Nagios Plugins:
sudo apt install nagios-nrpe-server nagios-plugins  # For Debian/Ubuntu
sudo yum install nrpe nagios-plugins-all  # For CentOS/RHEL
Configure NRPE:
Open the NRPE configuration file:
sudo vim /etc/nagios/nrpe.cfg # Path may vary depending on distribution
Add the IP address of your Energy Monitor server to the
allowed_hostsdirective:allowed_hosts=127.0.0.1,ENERGY_MONITOR_SERVER_IP
Define Commands in NRPE Configuration:
Add or modify commands in the
nrpe.cfgfile to match your monitoring requirements. Here are some example command definitions:command[check_load]=/usr/lib/nagios/plugins/check_load -w 5,4,3 -c 10,8,6 command[check_disk]=/usr/lib/nagios/plugins/check_disk -w 20% -c 10% -p / command[check_procs]=/usr/lib/nagios/plugins/check_procs -w 150 -c 200
Restart NRPE Service:
sudo systemctl restart nagios-nrpe-server  # For Debian/Ubuntu
sudo systemctl restart nrpe  # For CentOS/RHEL
Step 2: Configure Energy Monitor
Log in to the Energy Monitor web interface:
Open a web browser and log in to the Energy Monitor admin panel.
Add a new host:
Navigate to Manage -> Configure -> Hosts.
Enter host details:
Provide the hostname, IP address, and other required details.
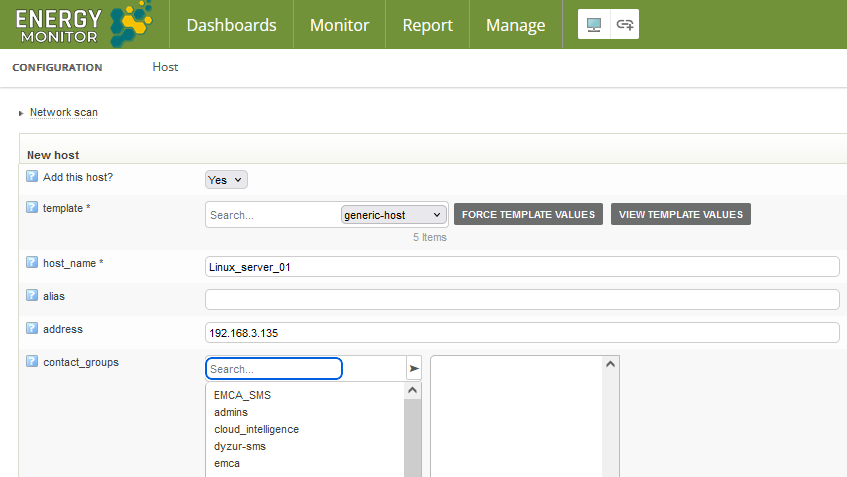
Save the configuration and perform a test:
Save the new host configuration and perform a monitoring test to ensure that Energy Monitor can communicate with the Windows host correctly.
Save Configuration and Apply Changes:
Save your configuration changes and apply them. This will update the Energy Monitor system to start monitoring the new Linux host and its services.
Step 3: Add services
Search for added host:
Use a search bar
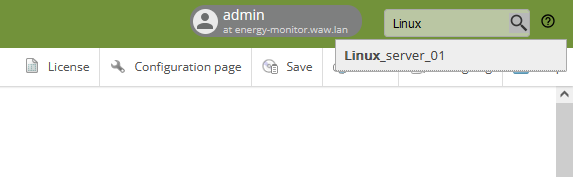
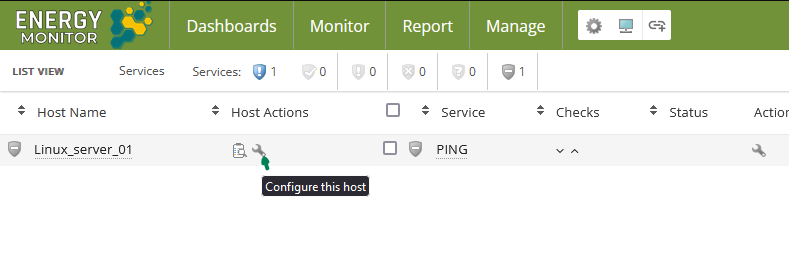
Open configuration:
Open configuration of freshly added host from listview:
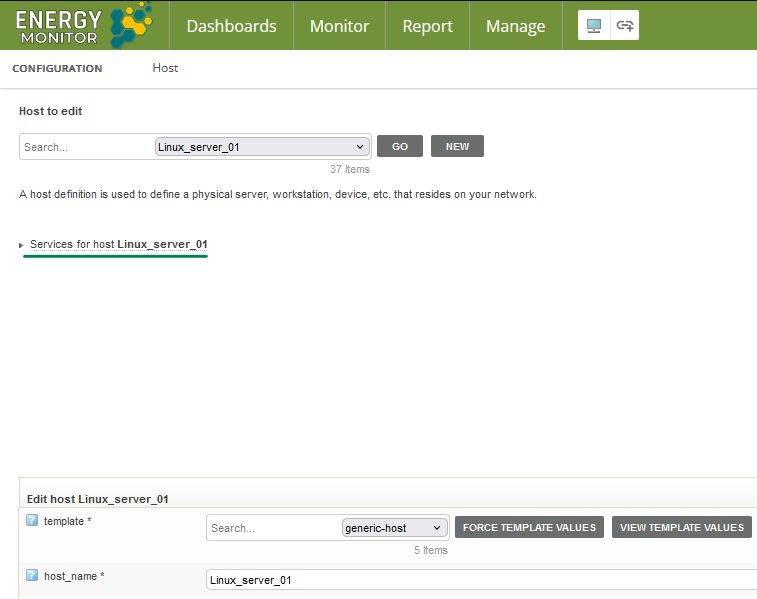
After open host configuration got to it services configuration:
Add service:
Fill service description(reuired)
Choose correct
check_commandto monitor required parameterFill
check_command_argsif required or createCustom Variable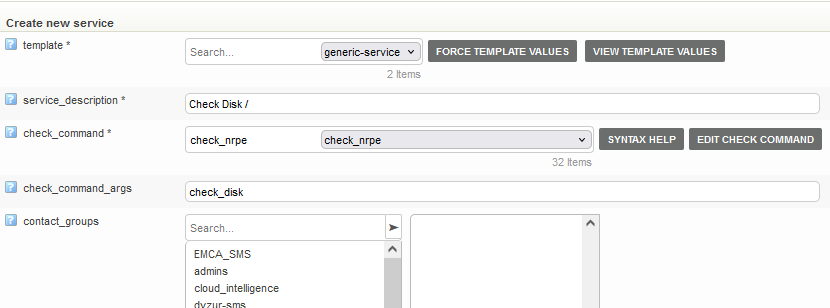
Test if configuration of new service is correct:
After filled up necessary firlds you can check response of service by clicking in
Test This Check: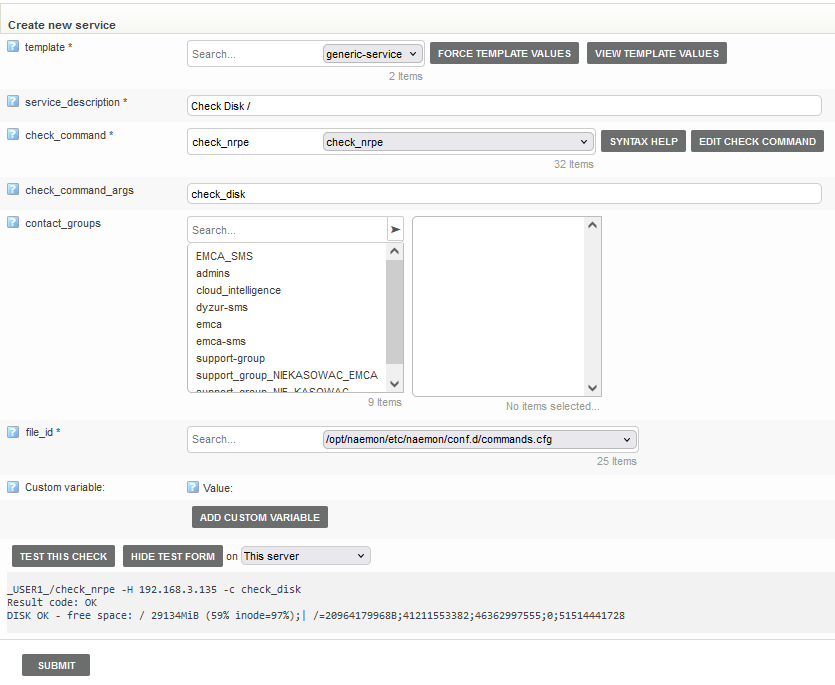
Submit and Save
All changes in configuration(like adding new object) need to be submited by clicking in submit button at the bottom of object configuration page.
Next you need to perform save like at “Add host” step.
Before perform save you can add as many services as you want.
Step 4: Verification and Monitoring
Verify Host and Services Status:
Check the Energy Monitor dashboard to ensure the newly added Linux host and its services are listed and being monitored.
Set Up Notifications:
Configure notifications to alert you in case of any issues with the monitored Linux host. Navigate to
Configuration->Notificationsand set up your preferred notification methods (e.g., email, SMS).
Benefits of Monitoring with Energy Monitor
Centralized Monitoring: Ability to monitor all Linux systems from a single, central location.
Early Problem Detection: Quickly identify performance and availability issues.
Compliance with Security Policies: Maintain compliance with internal and external security requirements.
Automation of Management: Automated data collection and reporting streamline IT infrastructure management.
By following this procedure, you can effectively monitor your Linux systems using Energy Monitor, ensuring high levels of system availability and performance.
Overseeing Bucket and Bucket service
This part of documentation provides an overview of the bucket and bucket service functionalities, their key features, and basic usage instructions.
Bucket Functionality
Overview:
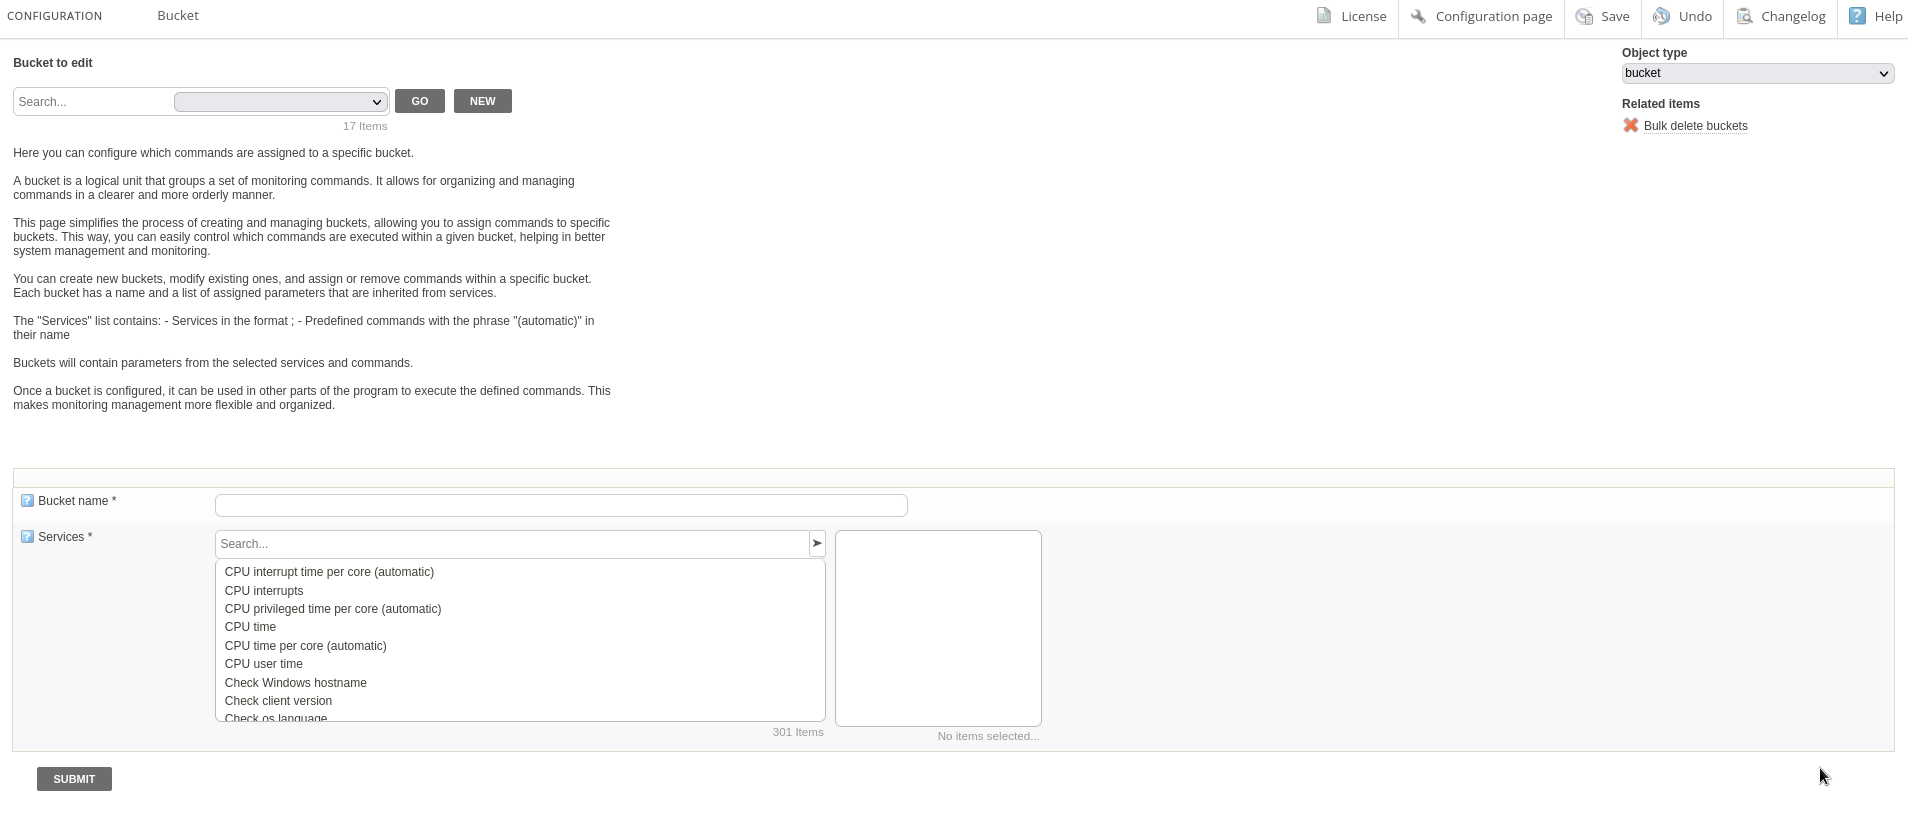
A bucket is a logical unit that groups a set of monitoring services. It allows for organizing and managing commands in a clearer and more orderly manner. This functionality simplifies the process of creating and managing sets of monitoring configurations that can be easily applied during hosts creation.
Key Features:
Create, edit, and delete buckets
Assign multiple services/commands to a bucket
Modify selected services/commands inside bucket
Organize monitoring commands into logical groups
Inherit parameters from selected services
Reuse bucket configurations across multiple hosts
Usage:
Creating a New Bucket:
Click the “NEW” button on the bucket configuration page
Enter a unique name for the bucket
Select services/commands to include in the bucket from the available list
Click “SUBMIT” to create the bucket
Types of Services in the Available List
The list of available services includes three main types:
Services inherited from existing hosts
These services’ names include the hostname from which they will be inherited
Example:
HostA;CPU Usage
Automatic services
These services have the word “automatic” in parentheses in their name
They are automatically added to the host based on one of the command parameters
Example:
CPU interrupt time per core (automatic)This command will be added for each core detected on the host during host creation
Standard services
These services do not have “(automatic)” in their name
They are not inherited from a specific host
These services do not operate automatically and must be manually configured for each host
Example:
Check os version
When selecting services for your bucket, consider which type of service best suits your monitoring needs for the hosts you plan to associate with this bucket.
Note: The "Services" list contains both individual services, predefined and predefined with "(automatic)" in their name.Buckets will contain parameters inherited from the selected services and commands. Once configured, buckets can be used in other parts of the monitoring system to create defined services/commands.
Automatic bucket services perform an automatic scan of the host and creates multiple services depending on the automatic parameter durng service creation. The automatic parameter is an argument used in the service command, such as disk, CPU core, or process.
Editing an Existing Bucket:
Select the bucket from the dropdown list
Click ‘GO’ button
Modify the bucket name if needed
Add or remove services/commands from the bucket
Click “SUBMIT” to save changes
Deleting a Bucket:
Select the bucket from the dropdown list
Click ‘GO’ button
Click the “Delete” button at the top right of the bucket configuration table
Bulk Delete Buckets
The bulk delete feature allows you to remove multiple buckets at once. This can be particularly useful for cleaning up or reorganizing your monitoring configuration.
How to Use Bulk Delete
Navigate to the Bucket Configuration page
Look for the “Bulk delete buckets” section
You will see a list of all available buckets
Select the buckets you wish to delete by clicking on them in the list
Once you’ve made your selection, click the “DELETE” button at the bottom of the section
Important Notes
Caution: This feature can be dangerous if used incorrectly
You will not receive any additional warnings before the deletion occurs
You will not be able to undo your changes through the normal undo functionality
Deletion action can impact other parts of your monitoring setup that rely on these buckets
Bucket Selection
The left column shows all available buckets
Use the search bar at the top to filter the bucket list
Selected buckets will appear in the right column
The count at the bottom shows the number of buckets currently selected
Deletion Process
After clicking “DELETE”, the selected buckets will be immediately removed
Ensure you have selected the correct buckets before proceeding
Remember that this action can impact other parts of your monitoring setup that rely on these buckets
By using the bulk delete feature, you can efficiently manage your bucket configurations, but always double-check your selections to avoid unintended deletions.
Bucket Service Functionality
Overview: The bucket service functionality manages individual services within a bucket in the monitoring system. It handles the configuration and management of specific monitoring services that are associated with a parent bucket. Key Features:
Manages CRUD operations for services within a bucket
Handles the relationship between services and their parent bucket
Provides methods for retrieving service configurations
Manages service-specific properties such as check commands, arguments, and custom variables
Interacts with the OpenSearch backend to store and retrieve service data
Usage:
Accessing Bucket Services:
Select the parent bucket from the dropdown list
Click ‘GO’ button to apply selection
From right panel click ‘Service of bucket: (bucket_name)’ - You will be taken to the service backet editing view (available if you are in bucket view)
Choose the specific service to edit from the service list
Click ‘GO’ button to apply selection
This view should appear:
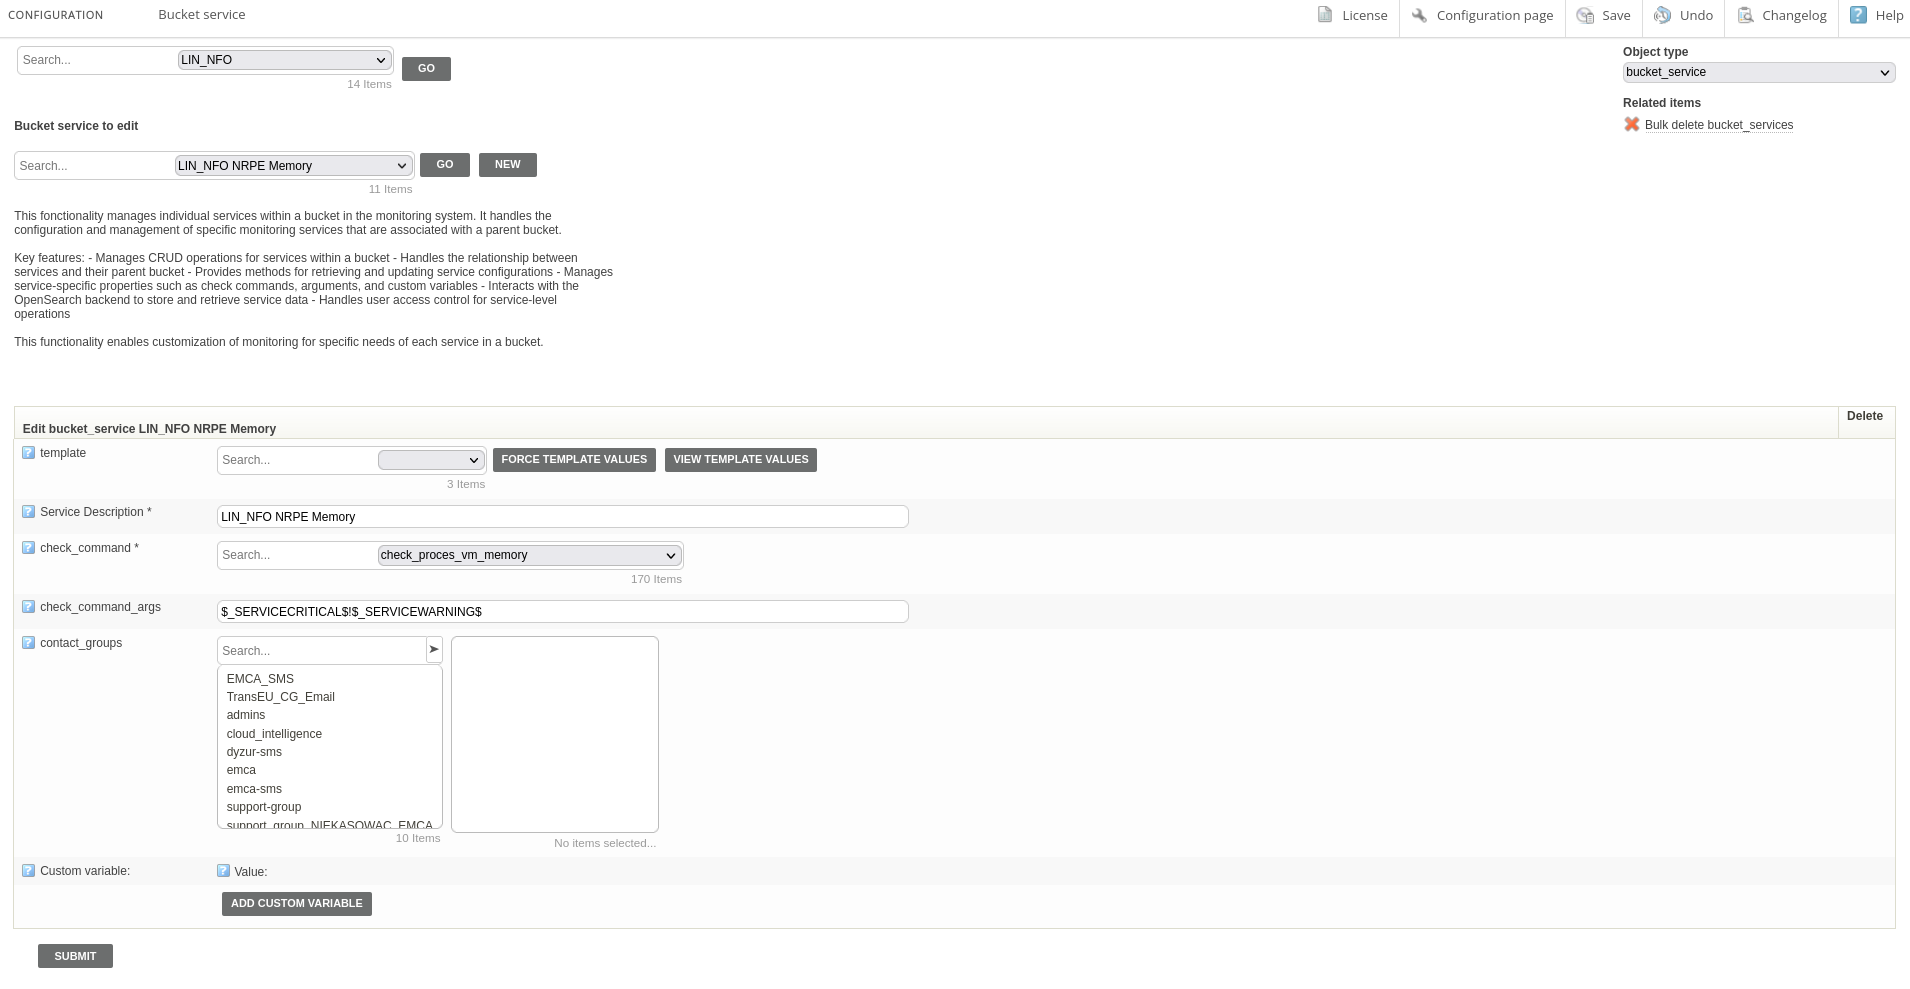
Editing a Bucket Service:
Modify the service description, check command, or command arguments as needed
Add or remove contact groups for notifications
Add custom variables specific to the service
Click “SUBMIT” to save changes
Important: When you modify any existing automatic service, a new service will be created in the bucket to replace the automatic one. This new service will reflect your changes, but the automatic feature will be lost. The original automatic service will no longer be present in the bucket.
Adding a New Bucket Service:
Click the “NEW” button next to the service list
Fill in the required fields (Service Description, check_command, etc.)
Add any necessary custom variables
Click “SUBMIT” to add the new service to the bucket
Deleting a Bucket Service:
Select the service from the list Click the “Delete” button at the top right of the service configuration table
Note: The bucket service functionality enables customization of monitoring for specific needs of each service in a bucket Template values can be forced or viewed using the respective buttons in the service configuration Custom variables can be added to fine-tune service checks and provide additional context
Bulk Delete Bucket Services
Similar to bulk delete for buckets, this feature allows you to remove multiple services from within a bucket at once. This is useful for refining the contents of a bucket or removing outdated services.
How to Use Bulk Delete for Bucket Services
Navigate to the Bucket Service Configuration page
Locate the “Bulk delete bucket_services” section
You will see a list of all available services within the selected bucket
Select the services you wish to delete by clicking on them in the list
After making your selection, click the “DELETE” button at the bottom of the section
Important Notes
Caution: This feature can be dangerous if used incorrectly
Deleting a bucket service will not delete any objects that depend on it
No additional warnings will be given before the deletion occurs
You can not undo your changes through the normal undo functionality
Service Selection
The left column displays all available services in the bucket
Use the search bar at the top to filter the service list
Selected services will appear in the right column
The count at the bottom shows the number of services currently selected
Deletion Process
Clicking “DELETE” will immediately remove the selected services from the bucket
Ensure you have selected the correct services before proceeding
Remember that this action can impact monitoring configurations that rely on these services
Service Naming Convention
Services are often named in the format:
BucketName;ServiceNameFor example:
LIN_CPU;LIN_CPU CPU System TimeThis naming convention helps identify which host the service was originally configured for
By using the bulk delete feature for bucket services, you can efficiently manage the contents of your buckets. Always double-check your selections to avoid unintended deletions and potential disruptions to your monitoring setup.
Scan Scheduler
The scheduler is designed for performing recurring tasks. Currently, it offers the capability to create cyclical tasks for scanning and adding hosts from a specified IP range. During scanning, buckets are utilized for automatic service creation for the detected hosts. Additionally, the scheduler allows for manual initiation of a single planned task, providing flexibility in task execution.

Scheduled Tasks Overview
When hosts and services are added by the scheduler or by a user, an information message appears above the table, for example: “There are 6 changes to 1 host objects and 4 service objects. More info.”
This message can be expanded to view details by clicking More info. It provides more specific information about hosts and services proposed for addition. To actually add these objects, you need to go to Manage -> Configure -> Hosts -> Network scan and save the changes.
The scheduler displays a table of all scheduled tasks with the following columns:
Description
IP Range
Top Domainname
Poller
Buckets
Schedule
Next Run
Created
Last Run
Status
Actions
The Status column provides important information about the task’s execution:
For tasks with a “Failed” status, a red shield icon is displayed.
Hovering over this icon reveals information about which log file contains details on the cause of the failure.
A summary of recent changes is shown at the top of the page.
Adding a New Scheduled Task
Click “Add New Task” at the bottom of the scheduled tasks list.
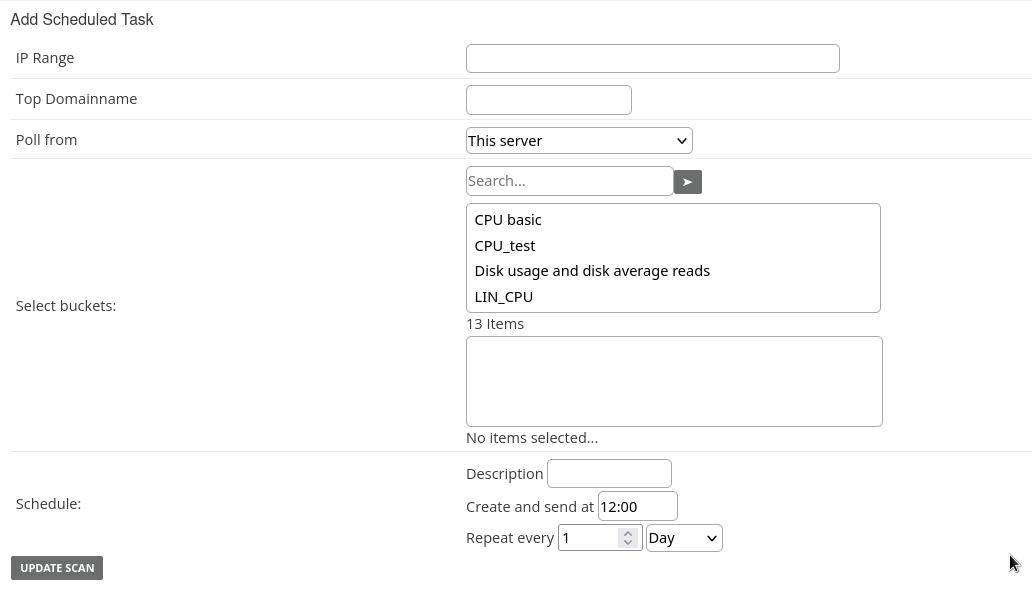
Fill out the “Add Scheduled Task” form:
IP Range
Top Domainname (optional)
Poll from
Select buckets
Description
Schedule:
Create and send at
Repeat every
Click “UPDATE SCAN” to create the task.
Preview of the screen for adding a new task:
Editing a Scheduled Task
Click “Edit” for the task you want to modify.
Update fields in the “Edit Scheduled Task” form.
Click “UPDATE SCAN” to save changes.
Other Actions
Delete: Remove the scheduled task
Run: Execute the task immediately
Scheduling from Host Configuration
Users can create a scheduled network scan task while configuring a new host:
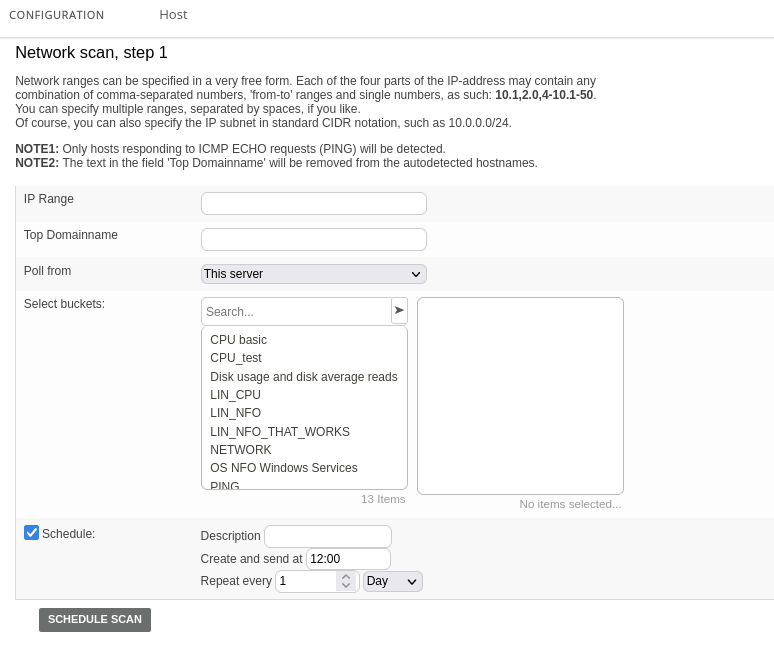
Navigate to Manage -> Configure -> Hosts -> Network scan.
In the “Network scan, step 1” module:
Enter the IP Range to scan.
Optionally, specify a Top Domainname.
Select the “Poll from” server (usually “This server”).
Choose the appropriate buckets for automatic service creation.
Check the “Schedule” box to enable scheduling options.
Fill out the scheduling details:
Description: Enter a description for the scheduled task.
Create and send at: Set the time for the scan to run.
Repeat every: Set the frequency (e.g., 1 Day).
Click “SCHEDULE SCAN” to create the scheduled task along with the new host configuration.
This feature allows users to set up regular scanning of newly added network ranges as part of the host discovery and configuration process, integrating network scanning directly into the host setup workflow.