Graphs
Creating a graph
The administrator can create 2 kind of graphs:
A collection of graphs
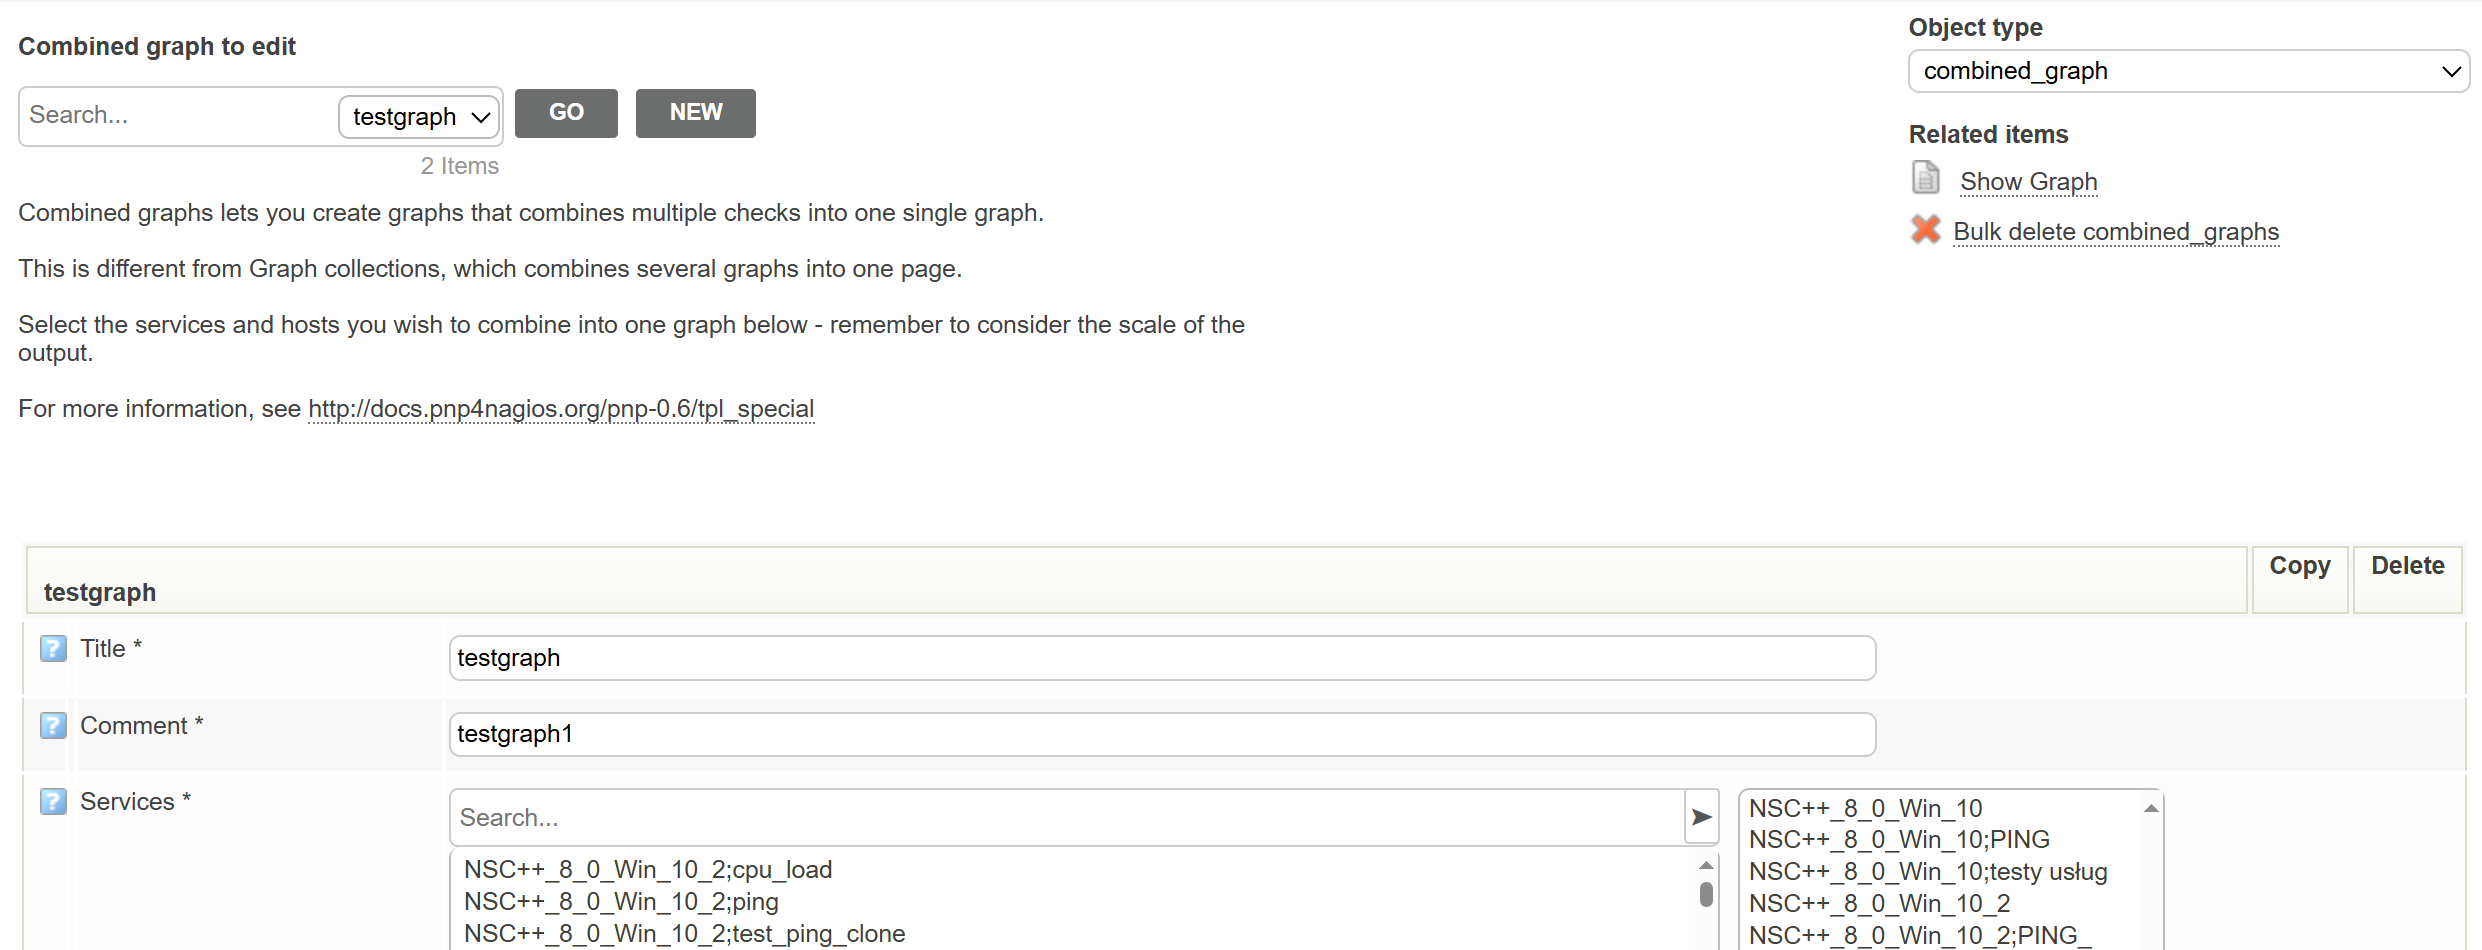
Combined graphs lets you create graphs that combines multiple checks into one single graph.
A combination of graphs
Graph collections are several graphs combined into one page.
Afterwards, save the changes into the database as you would changes to a host or a service.

1.Enter “Reports” -> “Graphs” -> “Manage Combined or Manage Collections”
Enter title of your graph, it’s description and choose services.
Click “Submit” then save the changes to the database with “Save graphs” button.
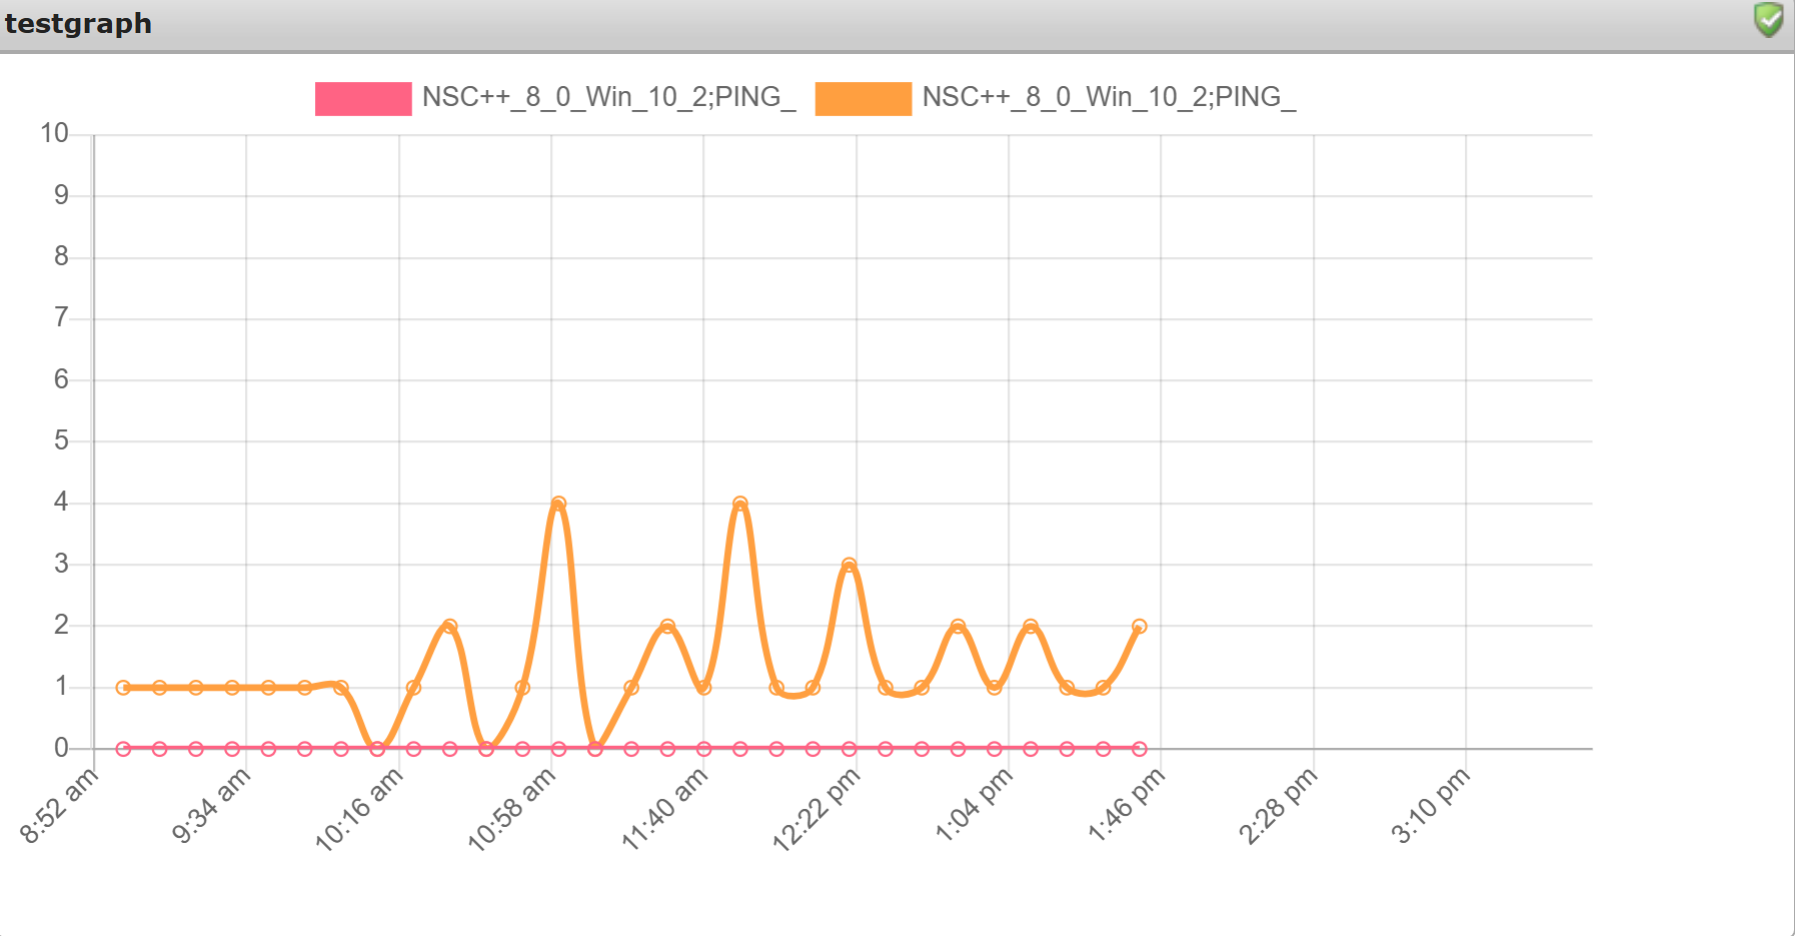
Viewing your graphs
Enter “Reports” -> “Graphs” -> “View Combined or View Collections”
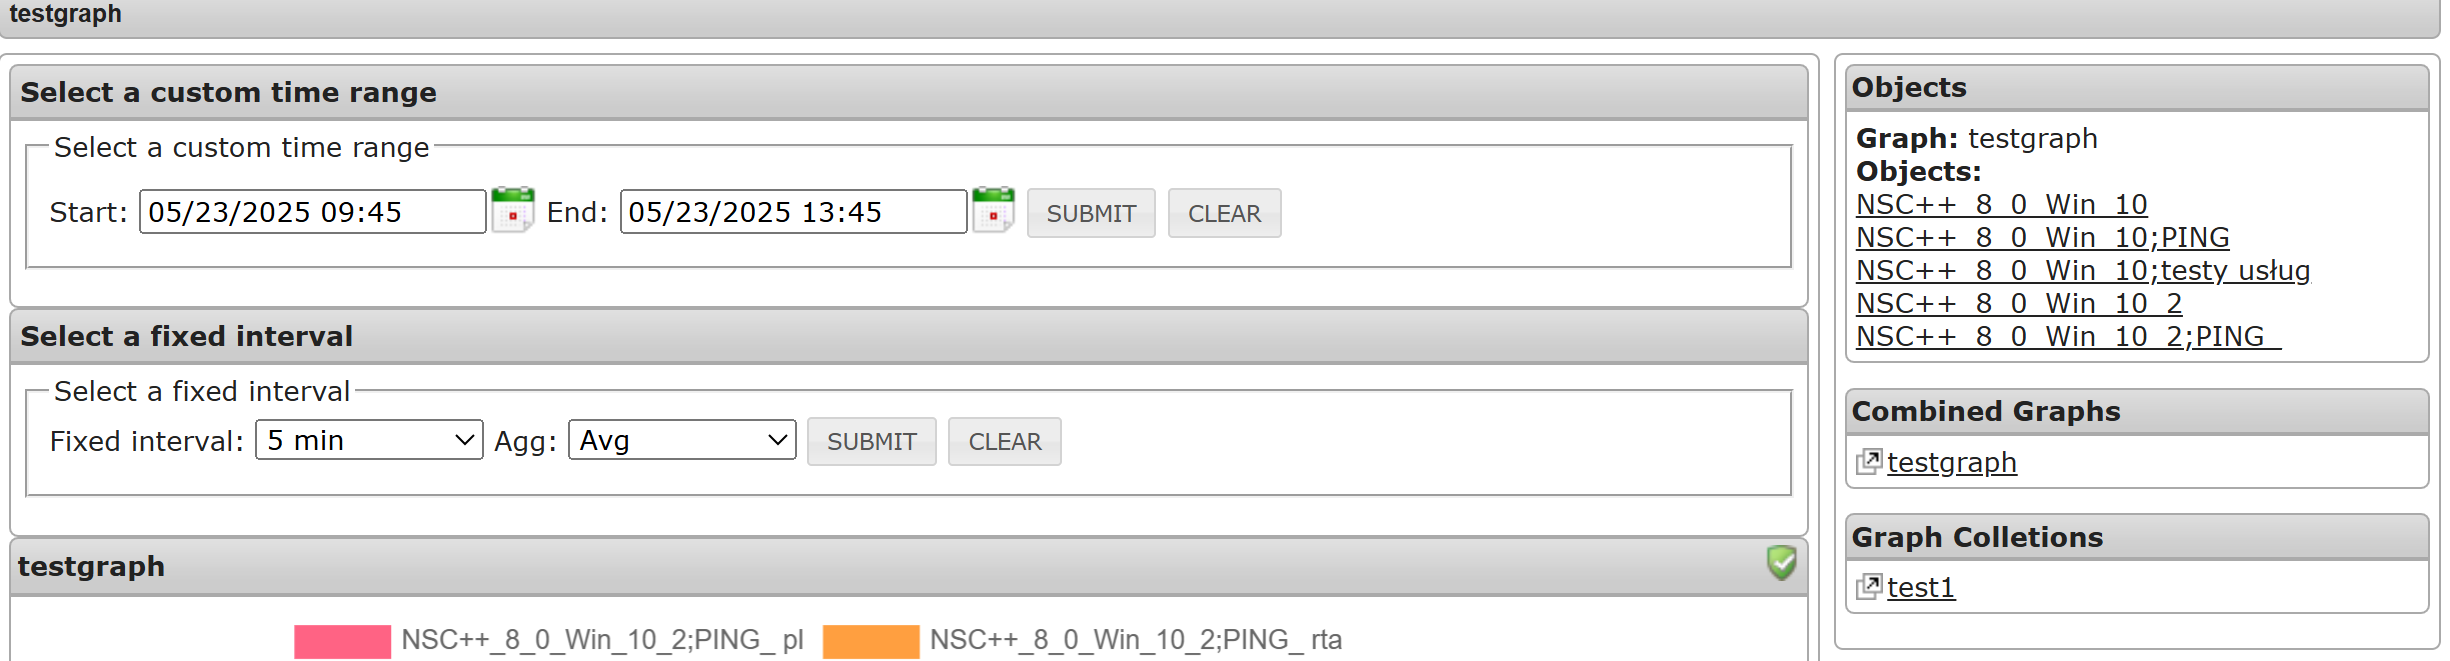
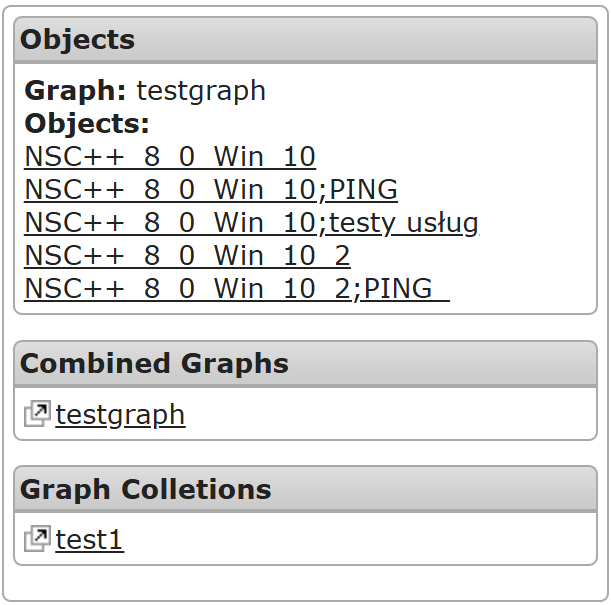
You can switch between objects with the menu on the right side of the screen.
You can also set a date range and intervals for refreshing data on your graphs.