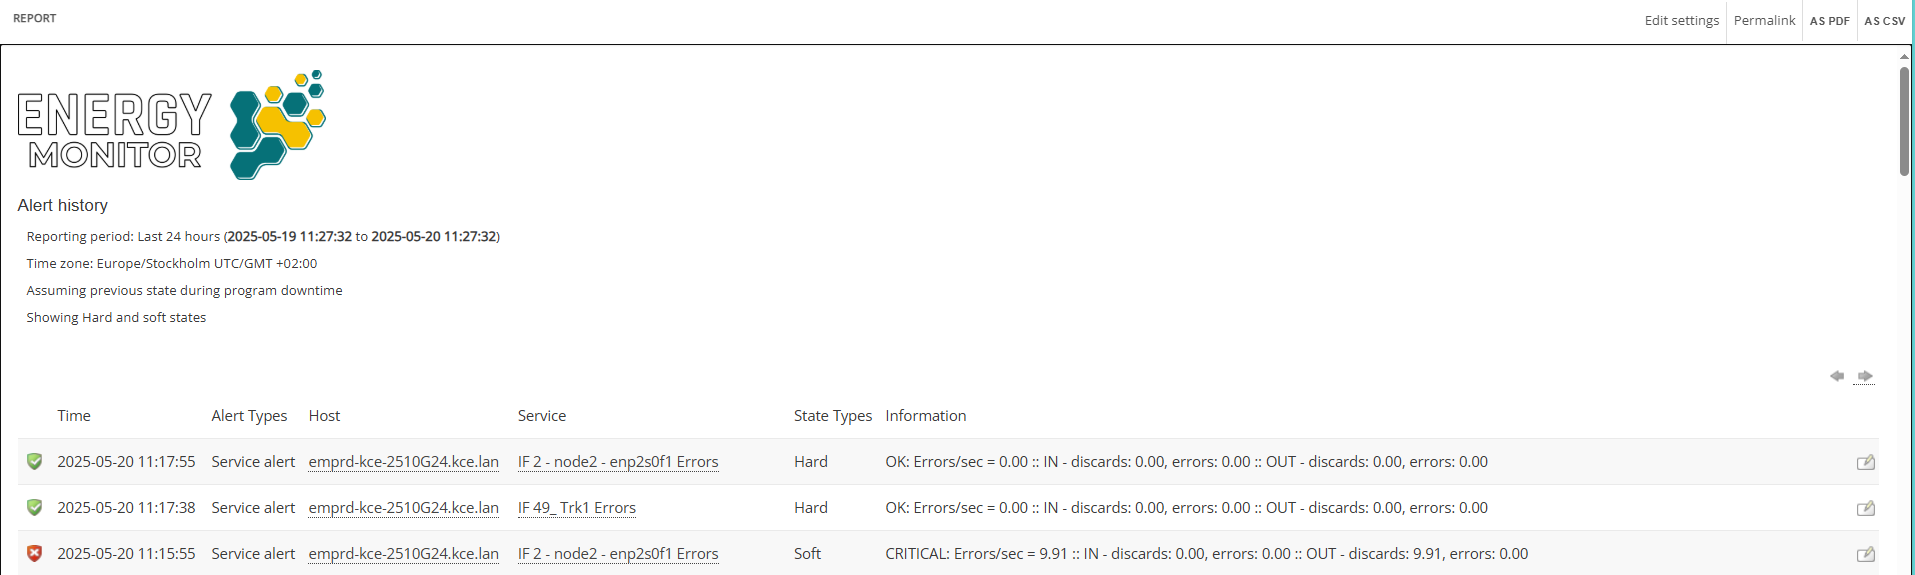
Alert history
Reports generated in Energy Monitor can be saved for a later use in a dedicated menu.
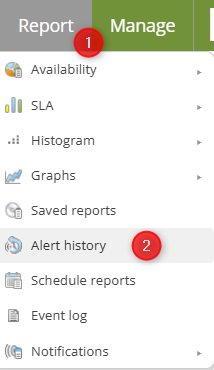
Enter “Report” -> “Alert History”
List of alerts is made up of several parameters:
- Time the alert occured

- Type of alert

- Host involved

- Service involved

- State type

- Details about the alert
Controls
Changing pages
You can change pages using the arrows.

Adding comments
It is possible to leave a note next to an alert by clicking the “Book” icon.


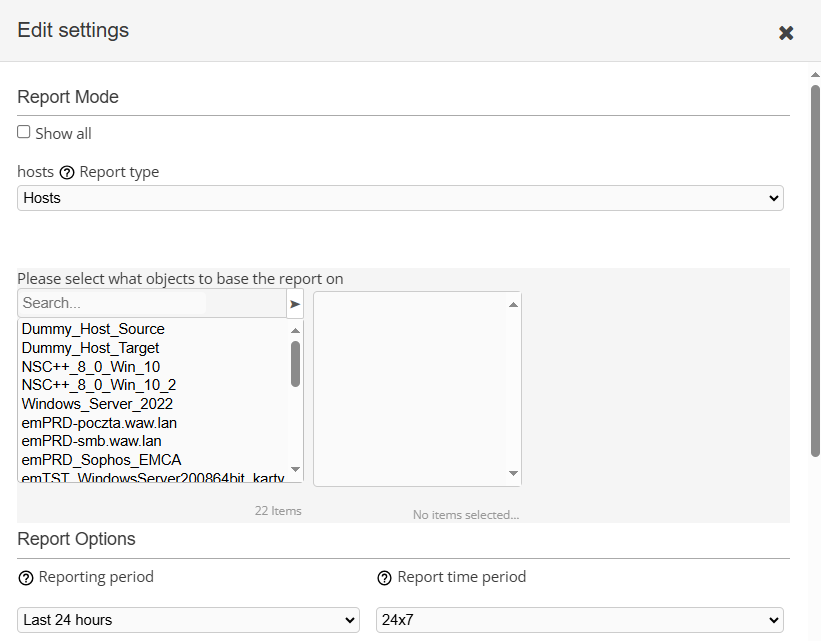
Changing setings of the list
List of alerts can narrowed down to defined parameters:
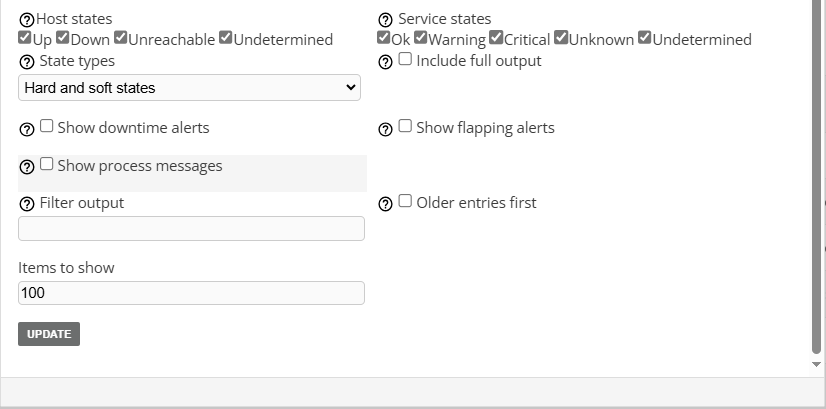
Note:Brief explanation of diferent states:
Soft states
Soft states occur when a host or service returns a non-OK/non-UP status however, number of tries, specified, hasn’t been reached yet. Essentially this is a status that shows that Energy Monitor tries to determine if there indeed is a problem, whether notification should be send.
Hard states
Hard states occur when the number of tries during soft states have been reached and status of the host or service hasn’t changed. Hard states are confirmed issues, notifications are sent in accordance to event handlers defined per service.
Flapping
Flapping occures when a host’s or a service’s status fluctates unnaturally, this normally causes “notification storms”. Fluctuating state prevents them, by suppressing sending problem and recovery notifications, sending simple “flapping start” and “flapping stop”.
Flapping is calcaulated as last 21 checks and weighted percentage of these state changes. Each host has configured “high threshold” and “low threshold”, if fluctuations exceed that “high” setting, the host/service receives the “flapping status”. Analogously if the percent change falls below “low” setting, flapping will stop.
Flapping threshold are set either globally or per host/service.
Flap detection thresholds can be globally set or customized per host/service. You can also specify which states to include in flap detection using the flap_detection_options directive. “flap_detection_options” governs this.