Widgets and Dashboards
Dashboards
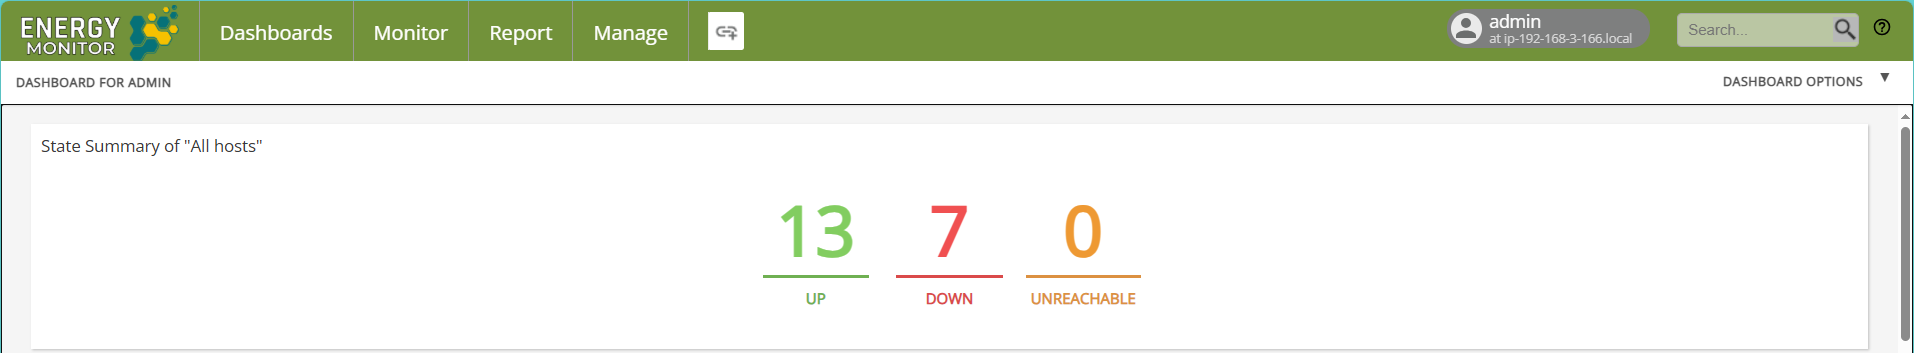
Dashboards allow the user to easily see the current state of the host and associated services, without the need to manually enter host's entry in EnergyMonitor.
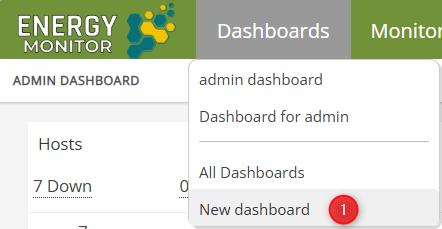
Adding Dashboards
Enter “Dashboards” -> “New Dashboards”
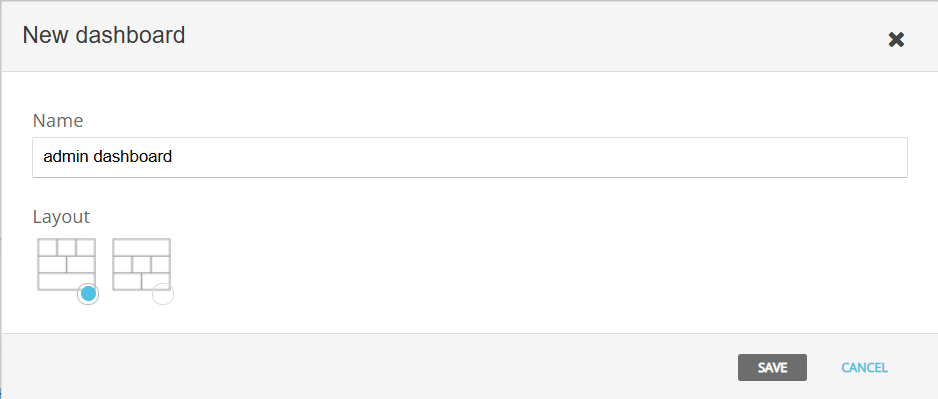
Pick the preferred layout and specify a name for your dashboard
Widgets
Widgets are predefined, components that allow the user to easily display a particular aspect of current state of EnergyMonitor on a larger interface, ie. a dashboard.
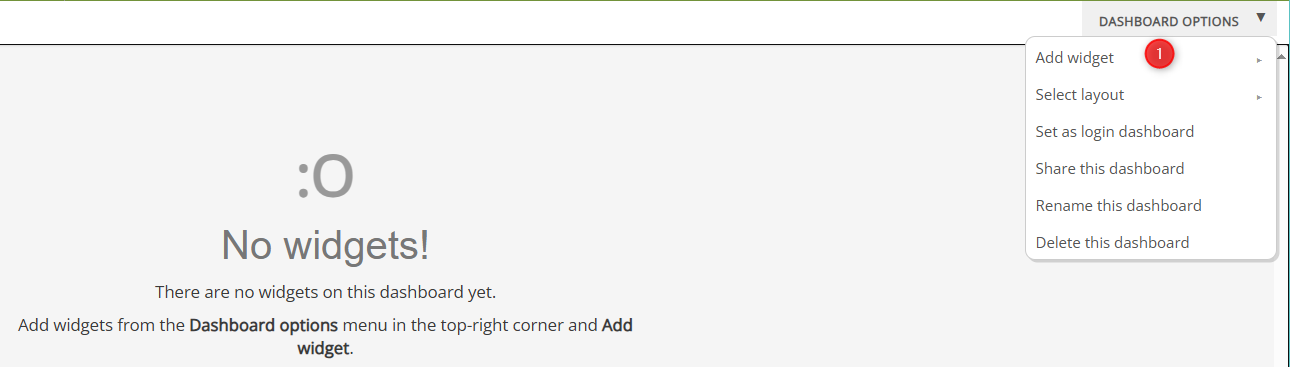
Adding a widget
Editing a widget
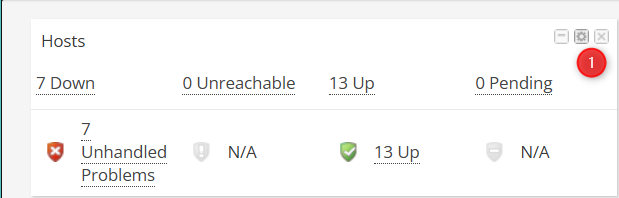
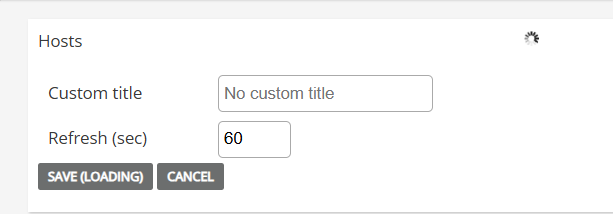
By clicking the gear icon the user can specify various parameters of the widget.
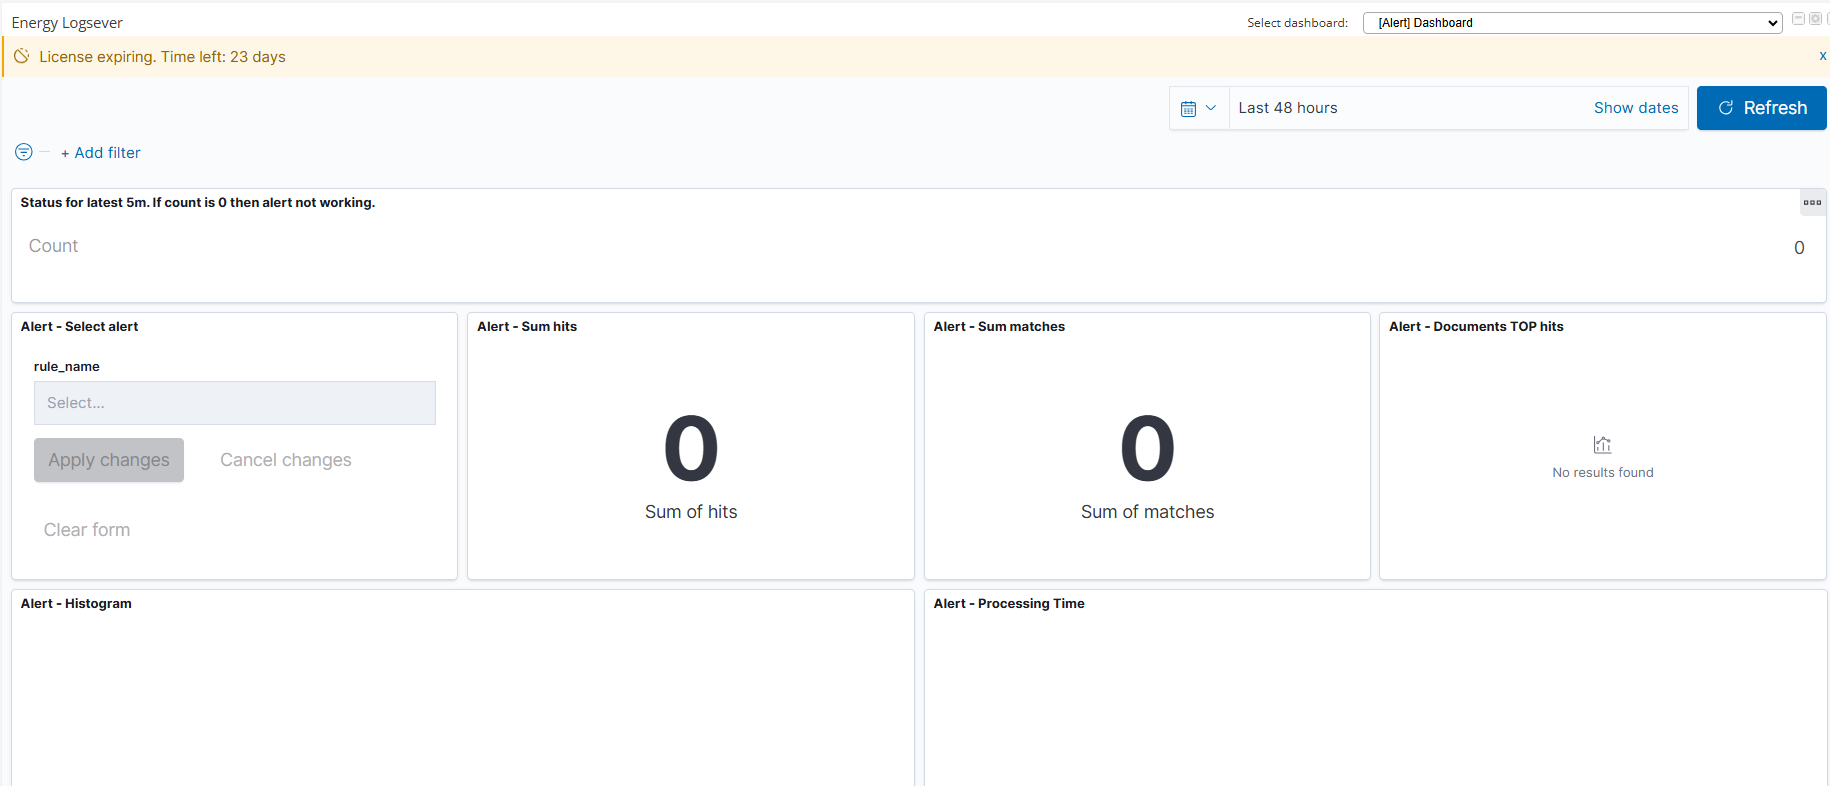
Logserver widget
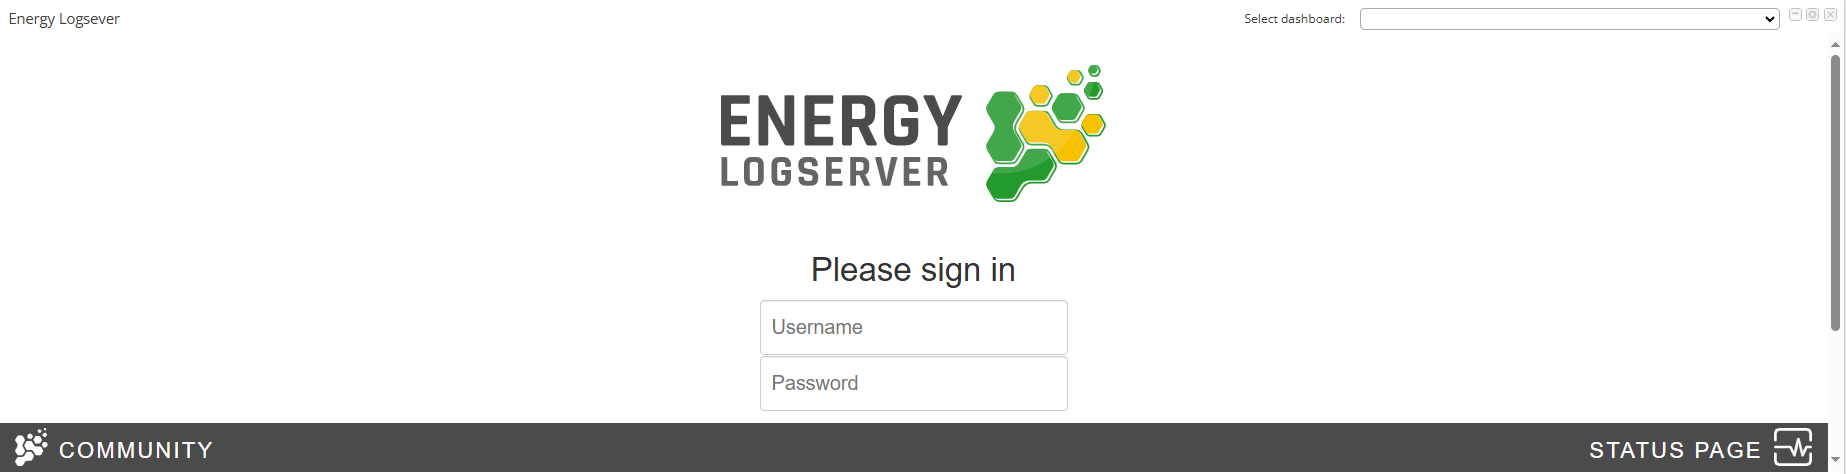
Logserver widget is worthy of a special mention, because it aggregates data from your Logserver instance and displays it in the form of a dashboard in Energy Monitor.
After adding the widget the administrator must log into Energy Logserver as he normally would.
Note:Keep in mind that if the widget is too small for your preference, you can increase it’s height using the menu under the “Gear” icon.
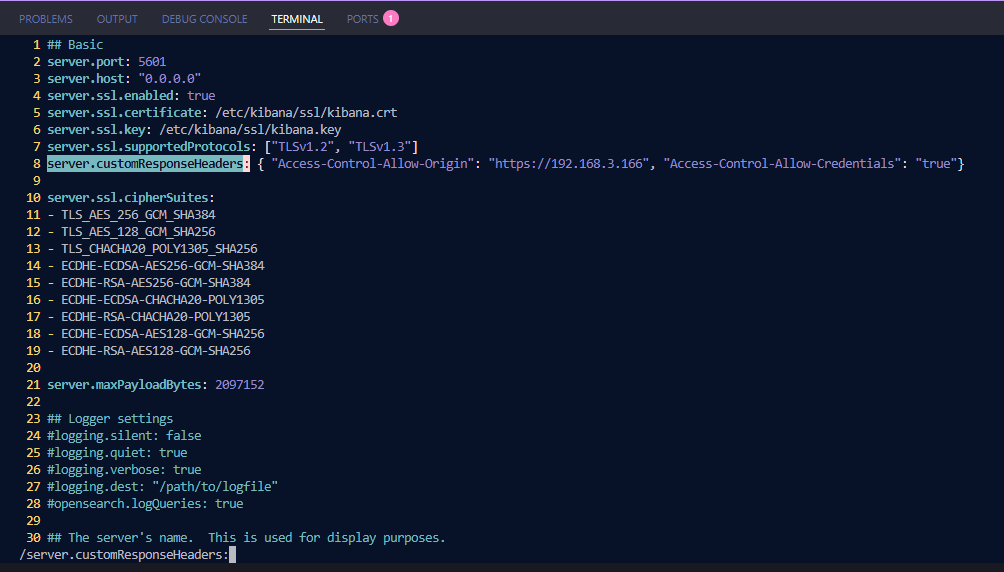
Additional Configuration Required:
On your LogServer host, under /etc/kibana/kibana.yml
Replace https://192.168.3.166 with IP of your Energy Monitor.
Add the following line:
login.isSameSite: "None"
This is neccessary to tell Kibana to allow placing elements from different sites.
Restart Kibana service with
systemctl restart Kibana