Process and Performance information
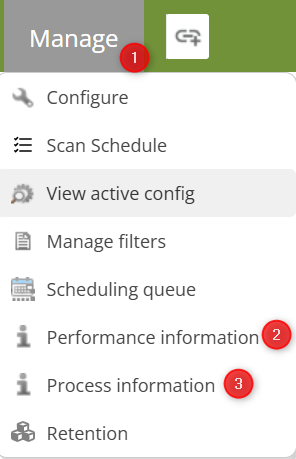
“Process information” and “Performance Information” are 2 menu’s that allow the administrator to easily look up how Energy Monitor performs.
Enter “Manage” -> “Configure” -> “Process information” / “Performance information”
Available Parameters
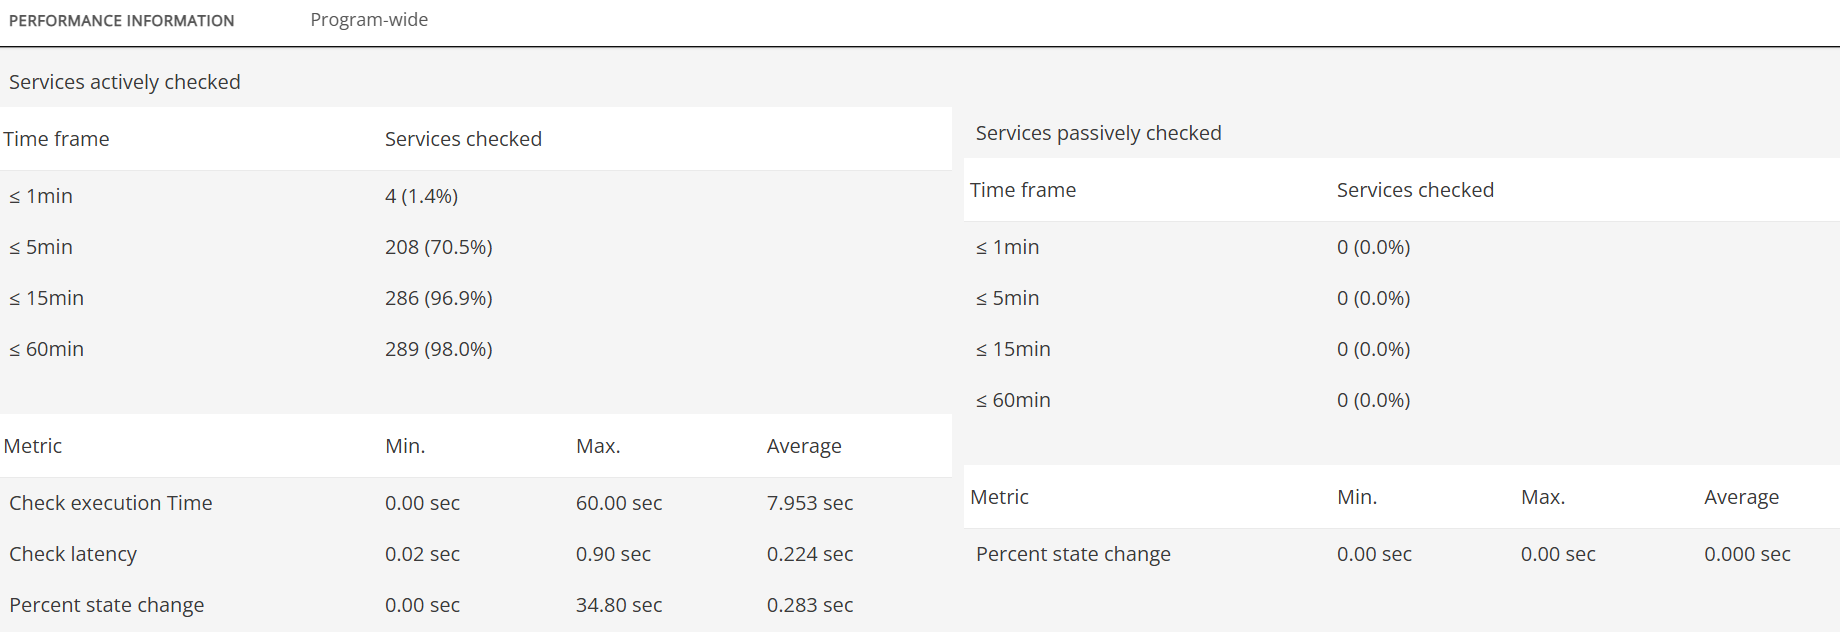
Performance Information
Gathered information includes:
Services actively checked across time frames
Services passively checked across time frames
Hosts actively checked across time frames
Hosts passively checked across time frames
Total statistics of hosts/services checks
Metrics, including:
Check execution Time
Check latency
Percent state change
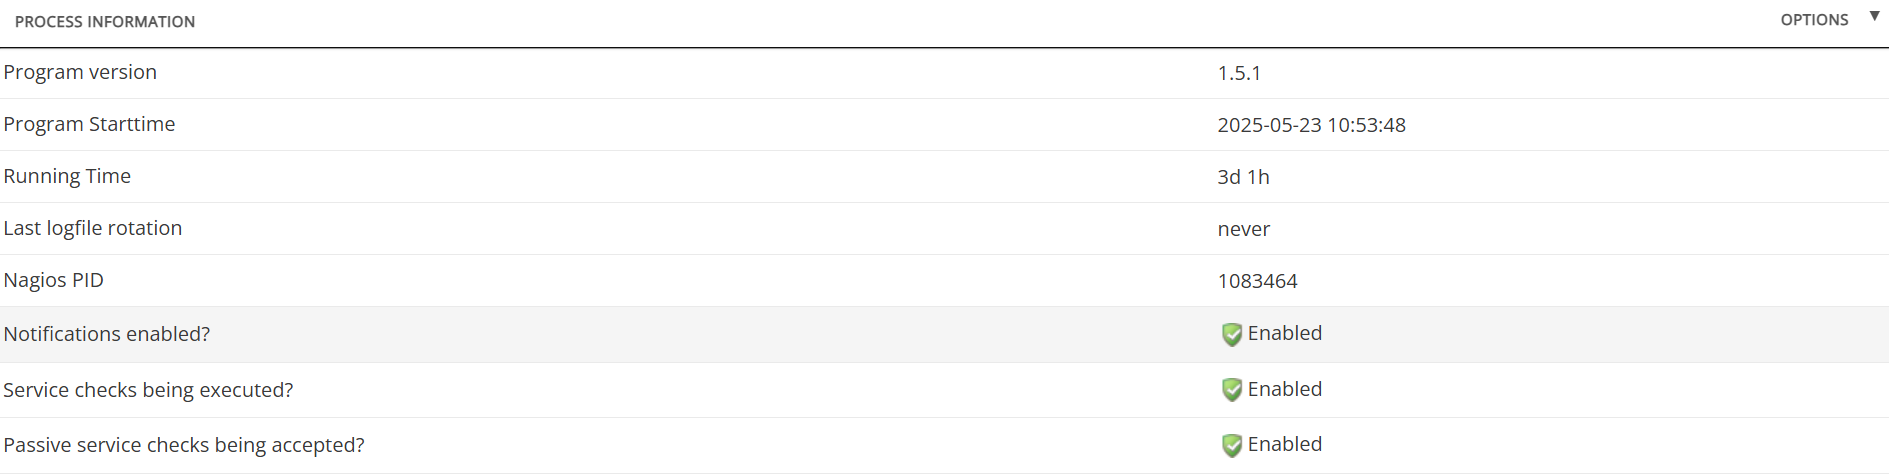
Process Information
Gathered information includes:
Program version
Program Starttime
Running Time
Nagios PID
Status of the following settings, if they are enabled or not:
Notifications enabled
Service checks being executed
Passive service checks being accepted
Host checks being executed
Passive host checks being accepted
Event handlers enabled
Obsessing over services
Obsessing over hosts
Flap detection enabled
Performance data being processed